BESS Auxiliary Loads: HVAC, Standby Losses and Net Round-Trip Efficiency

Quick answer: a battery energy storage system can lose useful energy even when the battery cells are not cycling. HVAC, liquid-cooling pumps, battery-management electronics, fire systems, communications, lighting and power-conversion standby demand all consume energy. To calculate the efficiency and revenue that the grid actually sees, meter these auxiliary loads and include them at the project boundary.
This guide shows how to build an auxiliary-load register, calculate net AC round-trip efficiency and avoid optimistic performance models—especially in hot Gulf climates and cold European sites.
Cell efficiency is not plant efficiency
A cell or DC block may have excellent charge-discharge efficiency, but a grid-connected plant also includes the power conversion system (PCS), transformer, cables, controls and environmental conditioning. The useful metric depends on the measurement boundary:
- DC efficiency: energy at the battery DC terminals.
- PCS efficiency: conversion efficiency at a stated load and voltage.
- AC block efficiency: charge and discharge energy at the PCS AC terminals.
- Net plant efficiency: energy measured at the contractual grid point, including auxiliaries and other site losses.
Always state the boundary. “90% efficient” is not meaningful without it.
What counts as an auxiliary load?
| Auxiliary | Typical operating driver | Data to collect |
|---|---|---|
| HVAC or chiller | Ambient temperature, solar gain, battery losses | kW, duty cycle, setpoints, seasonal profile |
| Liquid-cooling pumps | Battery or PCS temperature | speed, flow, kW, redundancy state |
| BMS and rack electronics | Continuous energization | active and sleep demand |
| EMS/SCADA/network | Continuous controls and communications | servers, switches, telecom power |
| Fire detection/suppression | Standby plus event operation | panel, heaters, compressors where applicable |
| Container heaters/dehumidifiers | Cold or humid conditions | thermostat and annual hours |
| Lighting and receptacles | Maintenance access | connected load and realistic hours |
| PCS/transformer standby | Energized state | night tare loss and no-load loss |
US Department of Energy BESS reporting guidance specifically calls for the auxiliary-load meter layout to appear on the single-line diagram and lists HVAC, pumps, lighting, fire systems, BMS, EMS and data equipment as loads to consider.
Worked daily-energy example
Consider a 10 MW / 20 MWh BESS completing one cycle:
- AC charging energy at the plant boundary before auxiliary adjustment: 21.5 MWh
- AC discharge energy before auxiliary adjustment: 18.5 MWh
- HVAC: 120 kW average for 10 hours = 1.20 MWh
- Controls, BMS and communications: 18 kW for 24 hours = 0.432 MWh
- Pumps and other auxiliaries: 25 kW for 8 hours = 0.20 MWh
Total daily auxiliaries = 1.832 MWh.
If the auxiliaries are supplied from the charging side and no separate export adjustment is needed, total grid energy input is:
Ein = 21.5 + 1.832 = 23.332 MWh.
Net round-trip efficiency becomes:
RTE = 18.5 / 23.332 = 79.3%.
The gross conversion figure without auxiliaries would be 18.5 / 21.5 = 86.0%. Ignoring auxiliary energy overstates this example by 6.7 percentage points.
Boundary and meter topology can change the equation
If auxiliaries are powered behind the discharge meter, their consumption may already reduce measured exported energy. If they have a separate utility feed, the project must add that import to the denominator. If part of the HVAC runs from the BESS DC bus, a different meter may capture it. Draw the meters on the single-line diagram and define positive directions before processing data.
A defensible test records synchronized cumulative import, cumulative export and separate auxiliary meters, plus state of charge at the beginning and end. A cycle that finishes at a different state of charge cannot be compared directly without an energy correction.
Why low-utilization systems suffer most
Fixed tare load is diluted when the BESS transfers large amounts of energy, but dominates when the system waits in reserve. A continuous 30 kW auxiliary load consumes:
30 × 8,760 = 262.8 MWh/year.
For a system transferring 14,600 MWh/year, that is 1.8% of throughput. If the same asset transfers only 2,000 MWh/year, it equals 13.1%. Efficiency therefore depends on dispatch pattern, not only equipment specification.
HVAC in Gulf conditions
High ambient temperature, solar loading, dust and filter fouling can raise cooling demand. A container nameplate HVAC capacity is not its average electrical load; model sensible and latent heat, envelope gain, battery/PCS losses, ventilation strategy and part-load performance. Confirm derating at design temperature and the N+1 operating philosophy.
Do not save energy by widening temperature limits beyond the cell and warranty requirements. NREL’s O&M guidance notes that active conditioning may be required and that auxiliary air-conditioning energy reduces delivered system energy; it also stresses the trade-off between conditioning energy, warranties and accelerated degradation.
Cold and humid European conditions
Cold sites may require battery or enclosure heating, while humid coastal sites can require dehumidification. Snow or ice can restrict air paths. The annual auxiliary model should use hourly weather data, not one summer design point. Include frost protection, condensate heaters and cold-start procedures where the supplier requires them.
PCS standby and transformer losses
PCS efficiency curves are usually load-dependent. At very low power, fixed internal losses can make percentage efficiency poor. Record standby, sleep and wake-up demand and the conditions that trigger each mode.
An energized transformer also has continuous no-load loss. For example, a 12 kW no-load loss produces:
12 × 8,760 = 105.1 MWh/year.
Whether the transformer can be de-energized safely during long idle periods is an operational, protection and reliability decision—not merely an energy-saving switch.
Gross and net KPIs to report
- Gross charge energy and gross discharge energy.
- Net import and export at the contractual meter.
- Auxiliary kWh by major subsystem.
- Average and peak auxiliary kW.
- Gross and net RTE.
- Energy throughput and equivalent cycles.
- Idle energy per day and per year.
- HVAC energy per MWh throughput.
- Availability excluding and including auxiliary-system outages.
Commissioning checklist
- Mark every meter and energy direction on the single-line diagram.
- Calibrate revenue and auxiliary meters to the required class.
- Time-synchronize PCS, BMS, EMS and meters.
- Test charge, discharge, idle, sleep and emergency modes.
- Measure HVAC at several ambient temperatures and power levels.
- Verify pump and fan redundancy states.
- Record start and end state of charge for RTE tests.
- Separate transformer no-load and load losses.
- Confirm whether auxiliary energy is already inside the PCC measurement.
- Store raw interval data, calculation scripts and configuration revisions.
Common modeling mistakes
- Applying a single cell efficiency to the entire plant.
- Using peak HVAC kW as a continuous annual load.
- Omitting standby consumption during reserve periods.
- Double-counting auxiliaries already captured by the grid meter.
- Comparing cycles with different start and end state of charge.
- Ignoring transformer no-load loss.
- Using one RTE value for all power levels and temperatures.
- Failing to revise the model after filter fouling or setpoint changes.
Short FAQ
Are auxiliary loads included in round-trip efficiency?
They should be included when the claimed metric is net plant RTE at the project boundary. State the boundary and meter arrangement explicitly.
Can HVAC be switched off while the BESS is idle?
Only if the manufacturer’s thermal, humidity, safety and warranty requirements remain satisfied. Idle batteries still need controls and may need conditioning.
Why can monthly efficiency fall even if the equipment is healthy?
Lower throughput spreads fixed standby and HVAC energy across fewer discharged MWh. Weather and dispatch changes can reduce the percentage without indicating a battery fault.
Practical conclusion
Build the loss model from meters, not marketing efficiency. Define the PCC boundary, track HVAC and standby energy separately, normalize results by throughput and retain operating context. This turns auxiliary load from an unexplained gap into a controllable design and O&M parameter.
Continue with our guides to MW versus MWh, UPS runtime and losses and pumped-storage efficiency. Primary references include the NREL PV and energy-storage O&M best-practices guide, DOE lithium-ion reporting requirements overview and NREL Annual Technology Baseline battery-storage assumptions.
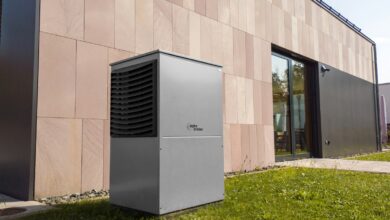
Featured photo: Sungrow EMEA via Unsplash, used under the Unsplash licence.