Fiber-Optic Link Budget for Substations: Losses, Margin and OTDR Checks
A substation fiber link should be accepted from a documented optical budget, not from a green Ethernet LED. The design must prove that the minimum transmitter output still reaches the receiver above its worst-case sensitivity after fiber attenuation, connectors, splices, aging, repairs, temperature effects, and measurement uncertainty. Commissioning then confirms end-to-end loss with a light source and power meter and locates individual events with an OTDR.
The three numbers that decide whether a link works
- Available optical budget: minimum transmitter power minus receiver sensitivity.
- Calculated path loss: fiber loss plus every connector, splice, splitter, WDM, patch panel, and other passive component.
- Remaining margin: available budget minus calculated loss and design reserve.
Available budget (dB) = PTX,min (dBm) − PRX,sensitivity (dBm)
Path loss = L × α + Σ connector loss + Σ splice loss + other losses
Operating margin = available budget − path loss
Because dB values are logarithmic, losses add directly. Keep dBm for absolute optical power and dB for gain or loss. Always use the transceiver datasheet values for the exact wavelength, fiber class, data rate, temperature range, and connector type.
Worked example: 12 km protection-and-control link
Consider a 12 km single-mode fiber route between two substations at 1310 nm. The selected optical interfaces specify a minimum launch power of −5 dBm and a worst-case receiver sensitivity of −24 dBm, giving 19 dB of available budget. The route contains four connector pairs and eight fusion splices. For a conservative design check, assume 0.35 dB/km fiber attenuation, 0.75 dB per connector pair, and 0.30 dB per splice. These are planning allowances; certified product values may be lower.
| Loss element | Calculation | Maximum planned loss |
|---|---|---|
| Fiber | 12 km × 0.35 dB/km | 4.20 dB |
| Connector pairs | 4 × 0.75 dB | 3.00 dB |
| Fusion splices | 8 × 0.30 dB | 2.40 dB |
| Total passive path | 4.20 + 3.00 + 2.40 | 9.60 dB |
| Available transceiver budget | −5 − (−24) | 19.00 dB |
| Operating margin | 19.00 − 9.60 | 9.40 dB |
If the project reserves 3 dB for aging, contamination, temperature, future repairs, and uncertainty, the design still has 6.4 dB of headroom. That is a robust paper result, but it does not replace commissioning. If a vendor specifies a maximum receiver input, also verify that a short or bypassed route cannot overload the receiver.
Why substation links need more than a generic IT budget
- Temperature: outdoor cabinets and unconditioned control rooms can shift transmitter output and receiver sensitivity.
- Vibration and contamination: dirty or poorly seated connectors can dominate loss on an otherwise short route.
- Multiple patch points: marshalling kiosks, ODFs, teleprotection panels, and network cabinets add connections.
- Protection availability: a marginal link can impair permissive trip, differential protection, GOOSE, time synchronization, or SCADA.
- Maintenance changes: emergency repairs add splices, while patching changes may reverse Tx/Rx or mix fiber types.
- Redundant paths: PRP or dual-channel schemes require separate budgets and tests for every physical path.
For the network behavior above the optical layer, use our IEC 61850 GOOSE troubleshooting checklist. For redundant architecture, see IEC 61850 PRP versus HSR.
Budget every component—especially the ones hidden in drawings
| Component | Design input | Field evidence |
|---|---|---|
| Fiber cable | Maximum attenuation at operating wavelength and temperature | Length and OTDR slope |
| Connector pair | Maximum permitted mated-pair loss | Inspection plus insertion-loss/OTDR result |
| Fusion splice | Project limit per splice | Bidirectional averaged OTDR event loss |
| Patch panel/ODF | Count every mated interface | Port schedule and photographs |
| Splitter/WDM/coupler | Manufacturer insertion loss and wavelength range | Model and serial record |
| Transceiver | Minimum Tx, sensitivity, maximum Rx, temperature class | Part number, DOM/DDM readings where supported |
Corning’s recommended test guidance expresses the same basic link-loss method: fiber attenuation multiplied by distance, plus connector and splice losses. Its worksheet cites 0.75 dB per connector pair and 0.3 dB per splice as conservative standards-based allowances. Use those only when appropriate to the specified cabling standard; the contract may set tighter acceptance limits.
Insertion-loss test versus OTDR
A calibrated optical light source and power meter measure total end-to-end insertion loss at the required wavelengths. That is the direct acceptance measurement for whether the installed channel meets its loss limit. An OTDR sends a pulse and analyzes backscatter and reflections to show distance, fiber attenuation, splice loss, connector reflectance, bends, breaks, and the end of the fiber. The instruments answer different questions and are strongest when used together.
- Tier 1: polarity, length, and end-to-end loss using an optical loss test set.
- Tier 2: OTDR event characterization and trace documentation.
- Do not substitute: an OTDR’s total loss number alone may not match an insertion-loss measurement.
- Test both wavelengths: for example 1310 and 1550 nm on single-mode links when required; bends often behave differently by wavelength.
OTDR setup that avoids false passes
- Inspect and clean first. Dirt can produce loss and reflections larger than the actual splice events.
- Use a launch cable. It moves the first connector beyond the OTDR’s initial dead zone so the near-end connection can be measured.
- Use a receive cable. It provides backscatter after the far-end connector so that connector can also be characterized.
- Set the correct refractive index. An incorrect value creates distance errors and misleading event locations.
- Select range, pulse width, and averaging time. A wider pulse reaches farther but increases dead zones and can hide closely spaced events.
- Test in both directions. Average splice loss from A→B and B→A to reduce backscatter-coefficient effects and identify apparent “gainers.”
- Save native traces and PDF reports. Screenshots alone are not enough for future comparison.
Fluke Networks explains that the launch cable lets the OTDR receiver recover from the large near-end reflection, while the receive cable makes the last connection measurable. It also recommends bidirectional testing because connector and splice results depend on test direction.
How to interpret common OTDR events
| Trace symptom | Likely cause | Action |
|---|---|---|
| Reflective spike with step loss | Connector, mechanical splice, air gap | Inspect, clean, reseat, verify adapter and polish type |
| Non-reflective step | Fusion splice or macrobend | Compare wavelengths and both directions |
| Gradual slope steeper than expected | High fiber attenuation or wrong settings | Check wavelength, refractive index, cable type, damage |
| Large end reflection | Open fiber end or break | Use distance reading and cable route to locate |
| Negative-loss “gainer” | Different backscatter coefficients | Average bidirectional measurements |
| Two events merged | Events inside attenuation/event dead zone | Shorten pulse width or use a higher-resolution OTDR |
Acceptance criteria for a protection fiber route
- Correct fiber type, wavelength, connector polish, and Tx/Rx polarity.
- Measured end-to-end loss below the approved calculated limit at every specified wavelength.
- Positive operating margin after the project reserve is deducted.
- No individual connector or splice above the project event limit.
- No unexplained bends, ghosts, reflective events, or length discrepancies.
- Bidirectional OTDR average for splices where required.
- Separate pass reports for main and redundant routes.
- Patch-panel labels match drawings, relay ports, switch ports, and telecom schedules.
- Protection, GOOSE, PRP/HSR, time synchronization, and failover tests completed after optical acceptance.
Troubleshooting a low receive-power alarm
- Record live DOM/DDM Tx and Rx levels before disturbing the link.
- Compare both ends; one weak direction often points to a dirty connector or failing transmitter.
- Inspect, clean, and re-inspect accessible connectors using the approved process.
- Measure end-to-end insertion loss with known-good reference cords.
- Run OTDR from both directions with launch and receive fibers.
- Compare traces with commissioning baselines to locate new loss or reflection.
- Verify that no optic, patch cord, wavelength, or fiber type was changed during maintenance.
Engineering references
- Corning Recommended Fiber Optic Test Guidelines and link-loss worksheet.
- Corning Fiber Optic Link Loss Budget Calculator.
- Cisco introduction to optical attenuation, budgets, and measurements.
- Fluke Networks OTDR guide and bidirectional testing guidance.
Final rule
A reliable substation fiber link needs three matching records: the design budget, the insertion-loss test, and the bidirectional OTDR traces. If any one is missing, engineers cannot distinguish a weak transceiver, dirty connector, bad splice, wrong patching, or damaged cable quickly enough when a protection channel fails.
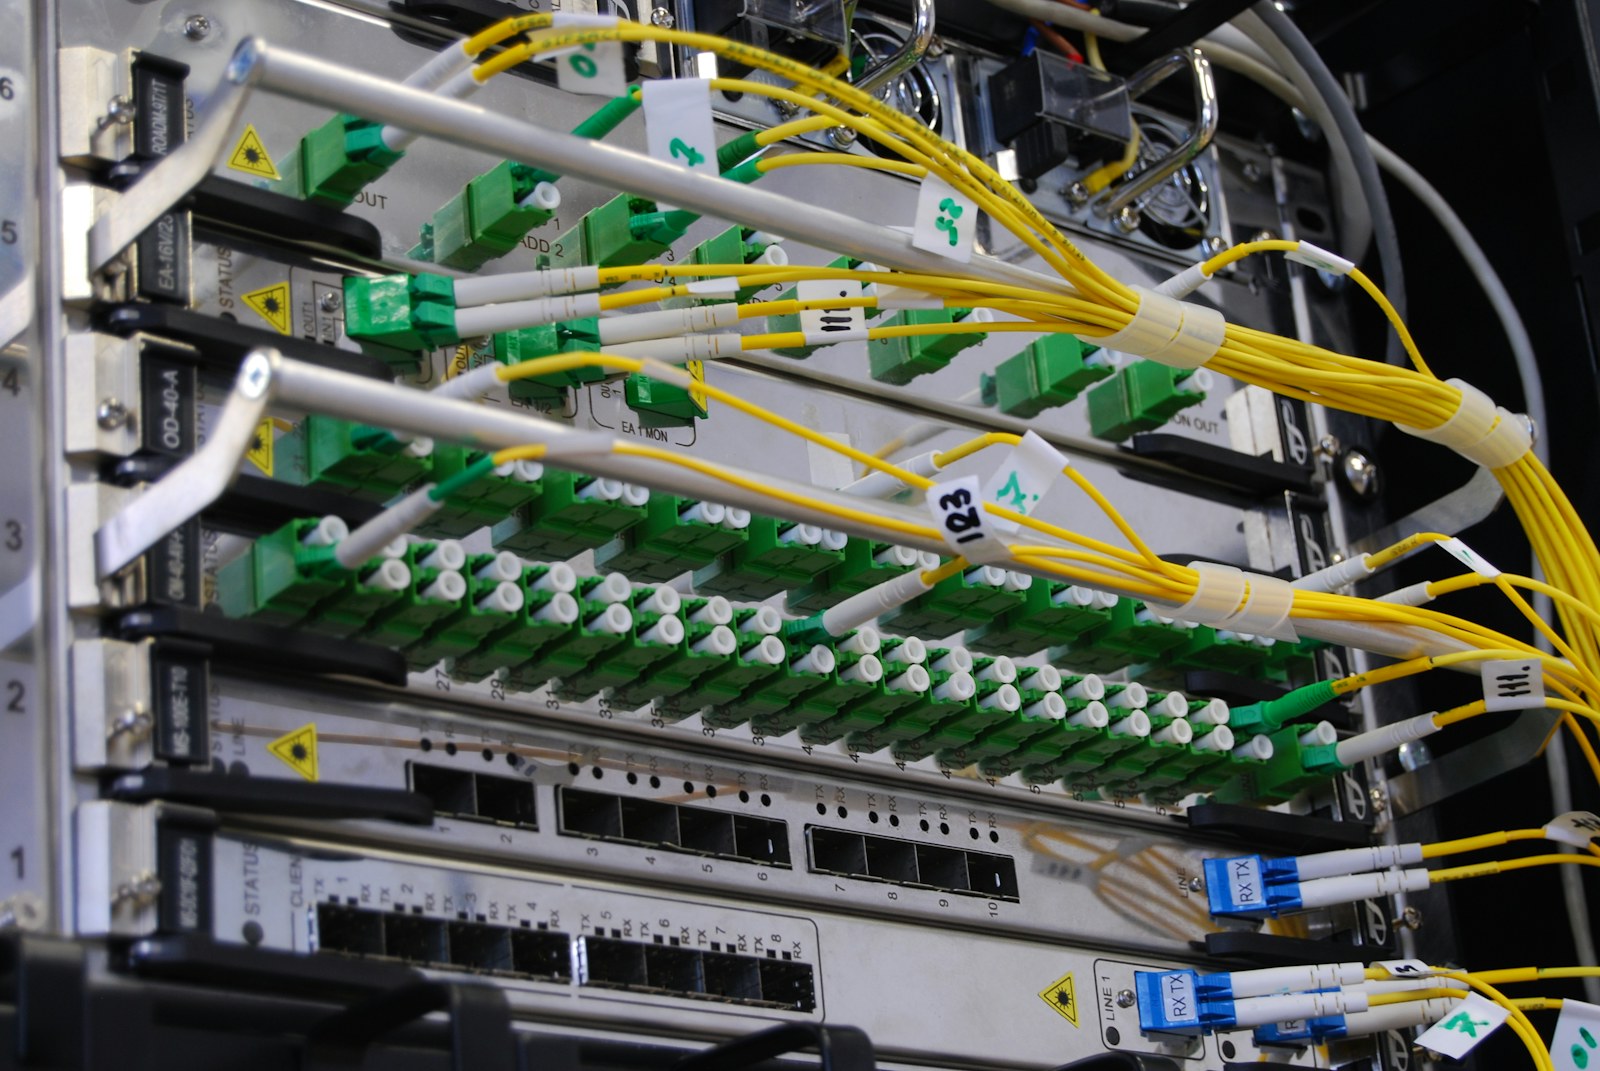
Featured photograph: Kirill Sh via Unsplash.