Pumped-Storage Hydropower Sizing: Head, Flow, Power and MWh
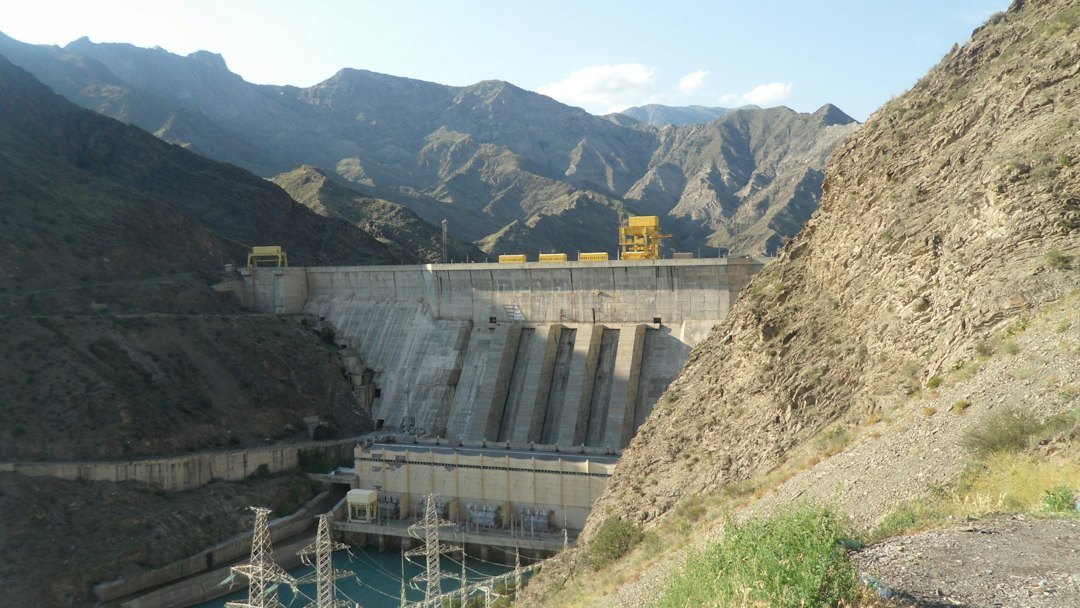
Quick answer: pumped-storage hydropower (PSH) stores electricity by moving water to an upper reservoir, then recovers part of that energy by releasing the water through a turbine. A first-pass design needs four numbers: usable water volume, gross and net head, turbine-generator efficiency, and the intended discharge time. Power depends mainly on head and flow; stored energy depends mainly on head and usable volume.
This engineering guide develops the equations, a worked example and a review checklist for early-stage studies in Europe, the Gulf and other regions. It is not a substitute for a hydraulic transient study, geotechnical investigation, environmental assessment or grid-connection study.
Why PSH is different from a conventional hydropower plant
A conventional plant converts natural water inflow into electricity. A pure pumped-storage plant first consumes electricity to lift water, then generates later when the grid values flexibility. The International Energy Agency glossary describes PSH as electricity storage based on converting electrical energy to gravitational potential energy. The US Department of Energy distinguishes open-loop projects, which connect to a naturally flowing water feature, from closed-loop arrangements with reservoirs that are not continuously connected to a natural water body.
PSH therefore has two ratings that must not be confused:
- Power in MW: how quickly the plant can charge or discharge.
- Energy in MWh: how long it can sustain a given output.
Step 1: calculate generating power from head and flow
For a preliminary generating estimate:
P = ρ × g × Q × Hnet × η
- P = electrical output in watts
- ρ = water density, approximately 1,000 kg/m³ for an initial estimate
- g = gravitational acceleration, approximately 9.81 m/s²
- Q = turbine flow in m³/s
- Hnet = net head at the turbine in metres
- η = combined turbine, generator and relevant mechanical efficiency
Net head is not simply the vertical difference between normal reservoir levels. Subtract hydraulic losses in intakes, tunnels, penstocks, valves and bends from gross head. Because losses rise strongly with flow, net head can vary across the operating range.
Worked power example
Assume a gross head of 420 m, hydraulic losses of 20 m at rated discharge, flow of 75 m³/s and combined generating efficiency of 90%.
Net head = 420 − 20 = 400 m.
P = 1,000 × 9.81 × 75 × 400 × 0.90 = 264,870,000 W, or approximately 265 MW.
This is a steady-state estimate. The final guaranteed output must use the supplier’s turbine characteristics, reservoir operating levels, waterway losses, generator limits and auxiliary consumption.
Step 2: estimate stored energy from usable water volume
The ideal gravitational energy of a usable water volume is:
E = ρ × g × V × H
To estimate delivered electrical energy, multiply by generating efficiency and convert joules to MWh by dividing by 3.6 billion:
Eout (MWh) = ρ × g × V × Haverage,net × η / 3.6×10⁹
If the usable volume is 2.4 million m³, the average net head across the discharge is 390 m and generating efficiency is 90%:
Eout = 1,000 × 9.81 × 2,400,000 × 390 × 0.90 / 3.6×10⁹ ≈ 2,296 MWh.
At a constant 265 MW, the simplified discharge duration is 2,296 / 265 ≈ 8.7 hours. A more realistic model steps through changing reservoir levels, head, efficiency and operational limits over time.
Step 3: check whether the flow and duration agree
Volume also provides a direct cross-check:
Time = usable volume / flow
For 2.4 million m³ at 75 m³/s, time = 32,000 seconds, or 8.89 hours. The value is close to the energy-based duration because the example uses similar average and rated conditions. A large mismatch often signals inconsistent head, efficiency, volume or flow assumptions.
Charging energy and round-trip efficiency
A storage plant always consumes more electrical energy while pumping than it later returns. If a scheme delivers 2,296 MWh and the assumed AC-to-AC round-trip efficiency is 80%, the required charging energy is:
Charging energy = 2,296 / 0.80 = 2,870 MWh.
Do not apply round-trip efficiency twice. Generating efficiency converts stored hydraulic energy to electrical output; pumping efficiency determines the electricity required to create that hydraulic energy. Round-trip efficiency combines the complete charge and discharge cycle, including relevant losses and auxiliary loads.
Reservoir geometry matters
A quoted reservoir volume is not automatically usable storage. Minimum operating level, freeboard, sediment allowance, intake submergence, environmental constraints and dead storage reduce the working volume. Head also changes as the upper reservoir falls and the lower reservoir rises. Build an elevation-area-volume curve for each reservoir and calculate energy in time steps rather than multiplying one nominal head by the total physical volume.
Waterway and transient checks
Long tunnels and penstocks introduce friction loss and dynamic pressure. A plant that changes output quickly must be assessed for water hammer, surge, pressure rise, minimum pressure, air admission and unit overspeed. Surge shafts, valve closing laws and control sequences are engineering decisions, not corrections that can safely be added after equipment selection.
The US Department of Energy turbine overview notes that turbine selection depends on head and flow as well as setting, efficiency and cost. Reversible pump-turbines add a further operating map: the unit must remain acceptable in pumping, generating, start-up and transition modes.
Grid-service requirements shape the rating
Before choosing MW and MWh, define the service:
- daily solar-energy shifting;
- wind-energy balancing;
- frequency response and reserves;
- black-start capability;
- congestion relief;
- multi-day adequacy support.
A high-power four-hour plant and a lower-power twelve-hour plant may use similar stored energy but provide different system value. Include minimum stable generation, ramp rate, start time, mode-change time, reactive-power range and minimum pumping power in the grid study.
European and Gulf project considerations
European projects may combine existing reservoirs, mines or brownfield infrastructure with high-value grid flexibility, but licensing, water ecology and network constraints remain site-specific. Gulf projects may be attractive where solar output is abundant and elevation is available, yet evaporation, water scarcity, high ambient temperature, dust, salinity and long grid connections require explicit study. Closed-loop concepts can reduce continuous interaction with natural waterways, but they still require a credible initial fill and make-up water plan.
Pre-feasibility calculation checklist
- Define grid service, required discharge MW and duration.
- Survey upper and lower reservoir operating levels.
- Derive usable volume from elevation-volume curves.
- Estimate waterways and calculate losses over the flow range.
- Calculate net head, power and energy at multiple operating points.
- Separate generating, pumping and round-trip efficiencies.
- Check pump-turbine operating range and cavitation constraints.
- Screen surge, water hammer and emergency shutdown cases.
- Include auxiliary loads, evaporation and make-up water.
- Compare civil works, grid connection, environment and permitting risks.
Common calculation errors
- Using gross head in the power equation without hydraulic losses.
- Treating total reservoir volume as usable volume.
- Confusing MW with MWh.
- Multiplying output energy by efficiency when calculating charging energy instead of dividing by round-trip efficiency.
- Assuming one efficiency value applies at every head and load.
- Ignoring changing reservoir levels and tailwater elevation.
- Quoting an eight-hour duration without checking flow and water volume.
Practical conclusion
Use P = ρgQHη to size instantaneous output and E = ρgVHη to estimate delivered energy. Then replace the single-point assumptions with reservoir curves, waterway-loss calculations and equipment performance maps. The arithmetic is simple; defensible inputs are the real engineering work.
Continue with our guide to MW versus MWh and storage duration and the battery-storage cable selection workflow. Authoritative background is available from the US Department of Energy PSH program and the IEA Electricity 2025 supply analysis.
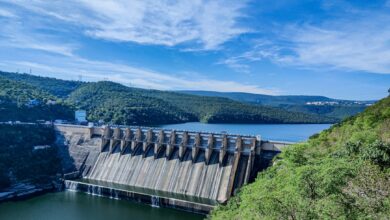
Featured photo: Dr Purna Sreeramaneni via Unsplash, used under the Unsplash licence.