Docker Energy Monitoring Stack: MQTT, InfluxDB and Grafana
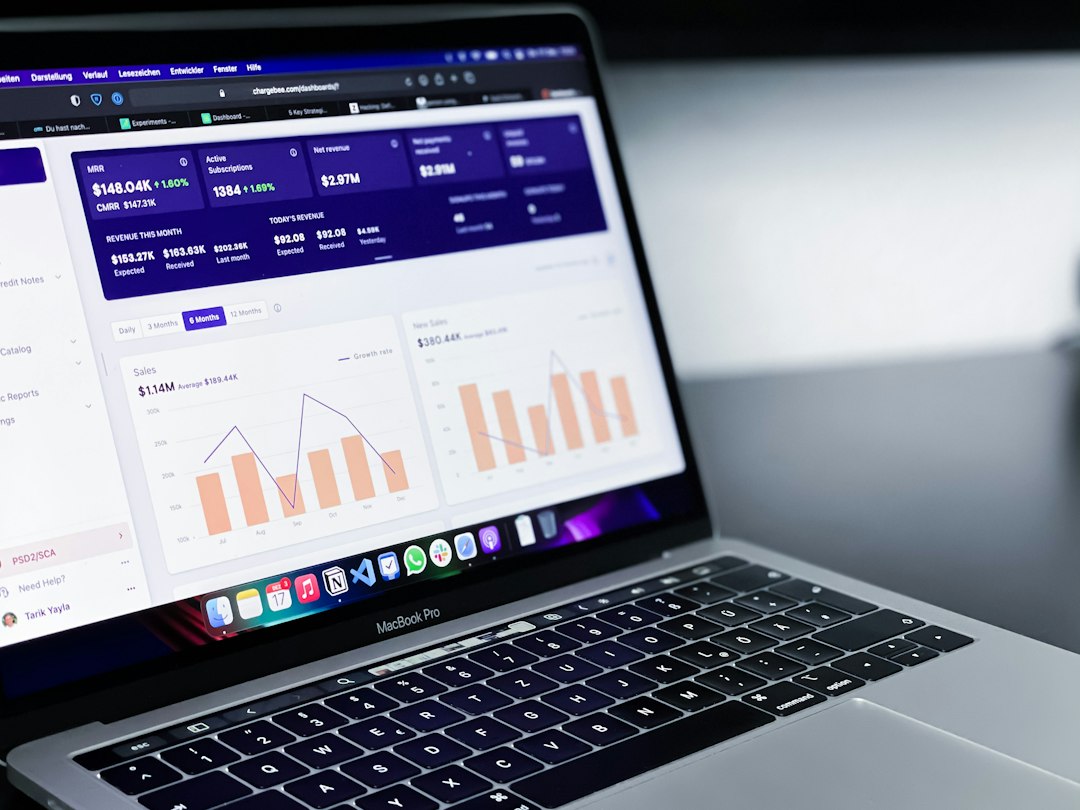
Quick answer: a practical energy-monitoring stack can use MQTT for telemetry transport, a collector to validate and transform messages, InfluxDB for time-series storage, and Grafana for dashboards. Docker Compose makes deployment repeatable, but production reliability still requires authentication, backups, retention and health monitoring.
Architecture
Meters or gateways publish readings to an MQTT broker. A collector such as Telegraf or a small application subscribes, validates timestamps and units, then writes points to InfluxDB. Grafana queries the database to display demand, energy, voltage, power factor and alarms.
Use a clear data model
Keep measurement names stable. Use tags for low-cardinality metadata such as site, building, meter and phase; use fields for numeric values. Avoid making serial numbers or timestamps into unbounded tags because excessive cardinality can degrade performance.
Docker Compose responsibilities
Define pinned image versions, named volumes, an internal network, health checks and restart policies. Put secrets in protected environment files or a secret manager, not in the Compose file committed to source control. Expose only the ports that users and devices actually require.
Retention and aggregation
One-second data is useful for diagnostics but expensive to retain indefinitely. Keep high-resolution data for a defined period, then downsample to 15-minute and daily values. Document whether energy totals are calculated from cumulative meter registers or integrated power; cumulative registers are usually more robust when messages are missing.
Security checklist
- Use MQTT authentication and TLS where supported.
- Grant each publisher access only to its topic path.
- Separate dashboard users from database administrators.
- Patch containers and scan images regularly.
- Back up both data volumes and configuration.
- Test restoration on another host.
Operational checks
Monitor message age, dropped writes, disk space, database latency and container restarts. Alert when a meter becomes silent or a cumulative register moves backwards. Synchronise time through a trusted source and keep the raw device timestamp where possible.
FAQ
Can this run on a small computer? Yes for modest point counts, but storage endurance, backups and cooling must be considered.
Should Grafana be exposed directly to the internet? Prefer a secured reverse proxy, VPN or controlled identity gateway with HTTPS and multifactor authentication.
Continue with Software, Networks and Cybersecurity.
Featured photo: path digital via Unsplash.