Solar Inverter Volt-VAR Control: Reactive Power, Power Factor and a Worked Curve
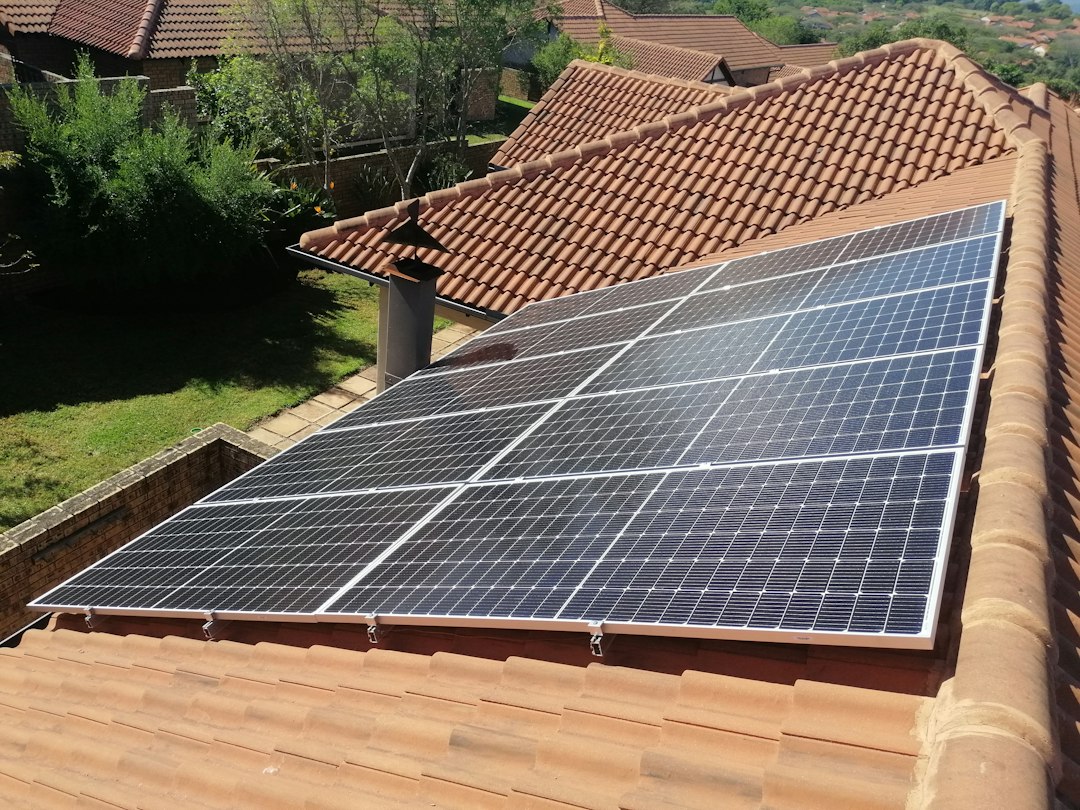
Quick answer: Volt-VAR control makes a solar inverter adjust reactive power as a function of measured voltage. A typical curve asks the inverter to supply reactive support when voltage is low, stay inside a deadband near nominal voltage, and absorb reactive power when voltage is high. The exact sign convention, curve points and priority between real and reactive power must come from the network operator and inverter documentation—not from a generic internet setting.
This guide explains the engineering logic, a worked interpolation example and the commissioning evidence needed for projects in Europe, the Gulf and other regions.
Why reactive power changes voltage
Distribution feeders have resistance and reactance. Real and reactive power flow therefore influence the voltage at the point of common coupling (PCC). On many feeders, injecting reactive power can support a low voltage while absorbing reactive power can help reduce a high voltage. The effect is not identical everywhere: cable-dominated networks, overhead feeders, transformer taps and nearby generators change the sensitivity.
A Volt-VAR function is local closed-loop control. It measures voltage, applies a configured Q(V) characteristic and commands reactive power within the inverter capability. It is not the same as a central optimal power-flow calculation, and it does not replace the network operator’s voltage-control plan.
Four control modes that are often confused
| Mode | Command | Typical purpose |
|---|---|---|
| Fixed power factor | Q changes with P to maintain a selected PF | Simple contractual operating point |
| Fixed reactive power | Constant kvar or per-unit Q target | Operator-directed support |
| Volt-VAR | Q changes with measured voltage | Local voltage response |
| Volt-Watt | Active power reduces above a voltage threshold | Overvoltage mitigation when reactive capability is insufficient |
Do not enable several functions without checking their interaction and priority. A plant controller, inverter firmware and utility setpoint can otherwise compete with each other.
Read the curve before entering numbers
A piecewise-linear Volt-VAR curve is commonly defined by voltage points V1–V4 and reactive-power points Q1–Q4. Between points, the controller interpolates. A central deadband between V2 and V3 often commands zero reactive power. Outside V1 and V4 the command may be limited at the end value.
Important questions include:
- Is voltage expressed in per unit of nominal, declared or reference voltage?
- Does positive Q mean injection or absorption?
- Is Q based on inverter kVA, plant MVA or available capability?
- What filtering and response time apply?
- Is there hysteresis or a time delay?
- Does reactive power take priority over active power?
Worked interpolation example
Consider an illustrative curve—not a universal setting:
- V1 = 0.94 pu, Q1 = +0.44 pu
- V2 = 0.98 pu, Q2 = 0
- V3 = 1.02 pu, Q3 = 0
- V4 = 1.06 pu, Q4 = −0.44 pu
Assume the project sign convention defines positive Q as injection. At V = 1.04 pu, the operating point lies halfway between V3 and V4. Linear interpolation gives:
Q = 0 + [(1.04 − 1.02) / (1.06 − 1.02)] × (−0.44 − 0) = −0.22 pu.
For an inverter with a 500 kVA reactive-power base, the command magnitude is:
Q = −0.22 × 500 = −110 kvar.
With this sign convention the inverter absorbs 110 kvar to oppose high voltage. Before commissioning, confirm that the actual manufacturer uses the same sign convention.
The kVA capability limit
An inverter cannot deliver arbitrary real and reactive power simultaneously. Ignoring short-term overload capability:
S² = P² + Q²
For a 500 kVA inverter exporting 480 kW, the remaining reactive capability is:
|Q|max = √(500² − 480²) ≈ 140 kvar.
The illustrative Volt-VAR curve requested 110 kvar, so it fits. If it requested 200 kvar, the controller would need to limit Q, curtail P, or follow another approved priority rule. This is why a curve cannot be assessed without the active-power operating point.
Power factor implied by the command
At P = 480 kW and Q = 110 kvar, apparent power is approximately 492.4 kVA and the power factor magnitude is:
PF = 480 / 492.4 ≈ 0.975.
Always state leading or lagging using the project convention. A numeric PF without direction is incomplete.
Where should voltage be measured?
The inverter terminal, low-voltage switchboard and PCC may have different voltages because of transformer and cable impedance. A controller acting on the wrong measurement point can regulate the inverter terminals while the contractual PCC remains outside limits. Document the voltage source, VT ratio, scaling, phase selection, averaging and loss of measurement behavior.
For a multi-inverter plant, decide whether each unit follows a local curve or a plant controller allocates a site-level Q command. Verify that the plant controller does not continually counteract autonomous inverter functions.
European and Gulf connection context
European requirements depend on the country, voltage level, generator type and distribution or transmission operator. In Great Britain, Engineering Recommendation G99 and the connection agreement can specify voltage, power-factor or reactive-power control behavior. Elsewhere, national implementation and the relevant network operator govern.
Gulf utilities similarly publish project-specific grid-connection requirements. High temperature can reduce inverter kVA capability, while long feeders and large daytime PV export can increase voltage sensitivity. Use the certified capability at the expected ambient and installation conditions—not the nameplate value alone.
This article is informational. The approved connection agreement, protection study and operator settings take precedence.
Commissioning test sequence
- Record firmware, parameter-file revision and approved curve.
- Verify nominal/reference voltage and VT scaling.
- Confirm Q sign convention with a small safe command.
- Test each curve corner and at least one point on every slope.
- Check the deadband and any hysteresis.
- Measure response time and settling without unstable oscillation.
- Test at high active power to prove the kVA limiter and priority rule.
- Verify plant-controller and inverter-mode coordination.
- Test measurement failure, communication loss and mode recovery.
- Retain time-synchronized P, Q, voltage, setpoint and alarm records.
Common mistakes
- Copying default curve points from a different grid code.
- Reversing the reactive-power sign.
- Using inverter-terminal voltage instead of the contractual PCC.
- Ignoring transformer tap position and feeder impedance.
- Assuming full kvar capability at full kW output.
- Enabling fixed PF and Volt-VAR simultaneously without defined priority.
- Testing only the deadband and not the sloped sections.
- Failing to retest after firmware or plant-controller changes.
Short FAQ
Does Volt-VAR consume battery or solar energy?
Reactive power does not represent net energy transfer in the same way as real power, but it increases current and converter losses. If kVA capability is limiting and Q has priority, active-power curtailment may occur.
Can Volt-VAR fix every overvoltage problem?
No. Reactive absorption has limits and may increase current or losses. Feeder reinforcement, transformer taps, export limits or Volt-Watt control may also be required.
Should the curve have a deadband?
Use the operator-approved characteristic. A deadband can reduce unnecessary control activity, while a narrow or absent deadband may provide more continuous support but needs stability review.
Practical conclusion
Translate the approved Q(V) curve into explicit voltage, reactive-power, sign and priority definitions. Check the kVA circle at realistic active power, test every segment and verify voltage at the correct point. The arithmetic is simple; the engineering risk lies in conventions, coordination and capability limits.
Continue with our commercial PV sizing guide, Qatar solar grid-connection workflow and three-phase power and power-factor calculation. Authoritative background includes the US Department of Energy smart-inverter Volt-VAR test example and the applicable local connection standard.
Featured photo: Sergio Martins via Unsplash, used under the Unsplash licence.