How to Write an Engineering Lab Report: Structure, Results and Uncertainty
An engineering lab report is not a diary of what happened in the laboratory. It is a concise technical argument: you define a question, explain a reproducible method, present evidence, quantify uncertainty, and show what the evidence means. This guide gives students a practical structure that works for electrical, electronics, mechanical, energy, and computer-engineering experiments.
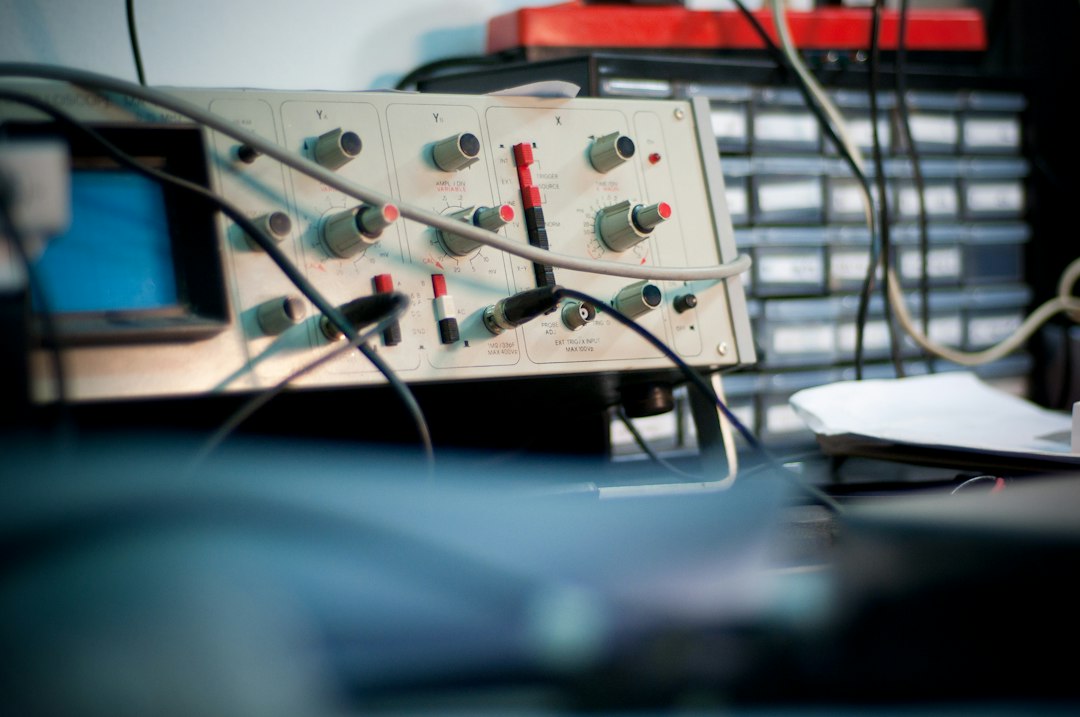
Laboratory measurement setup. Photo by Blaz Erzetic on Unsplash.
Quick answer: the recommended report structure
- Title and abstract: identify the experiment, method, most important numerical result, and conclusion.
- Objective: state the engineering question or hypothesis in measurable terms.
- Theory: introduce only the equations and assumptions needed to interpret the results.
- Method: document equipment, circuit or system configuration, procedure, and measurement settings.
- Results: show processed data in readable tables and figures, including units and uncertainty.
- Discussion: compare the evidence with theory, explain deviations, and evaluate limitations.
- Conclusion: answer the objective with numbers rather than repeating the introduction.
- References and appendices: cite sources and place long raw-data tables or code outside the main narrative.
1. Write the objective before the experiment
A weak objective says, “to study an RC circuit.” A useful objective says, “to measure the time constant of a 10 kΩ–100 µF RC circuit and compare the experimental value with the theoretical value within the combined measurement uncertainty.” The second version tells you what to measure, what to calculate, and how success will be judged.
If the laboratory has several tasks, convert them into two or three testable questions. This prevents the report from becoming a sequence of disconnected screenshots and calculations.
2. Keep the theory focused
Include the minimum theory required to understand your method and evaluate your result. Define every symbol when it first appears, use SI units, and state assumptions. For an RC discharge, for example, the essential model is:
V(t) = V0e−t/RC
You should then explain that the time constant is τ = RC and that the voltage falls to approximately 36.8% of its initial value after one time constant. Do not copy a full textbook chapter. Connect each equation to a quantity you actually measured.
3. Make the method reproducible
A reader should be able to repeat the experiment without asking you what you did. Record the manufacturer and model of important instruments, component tolerances, software version when relevant, sampling rate, oscilloscope probe setting, calibration state, environmental conditions, and the exact circuit or system configuration.
A good method is written as a controlled procedure, not as a list of button clicks. Explain why you selected a measurement range or sampling interval. Include a labeled circuit diagram or block diagram where it makes the setup clearer. For safety-critical work, identify isolation, grounding, protective equipment, and the point at which power was removed before rewiring.
4. Present results so they can be checked
Separate results from interpretation. A results section should contain clean evidence: tables, plots, calculated values, and uncertainty. Every table needs a descriptive caption; every column needs a quantity and unit. Every graph needs labeled axes, units, a legend when multiple series are present, and enough resolution to read the data.
Avoid showing five screenshots when one properly exported plot communicates the same information. Keep raw instrument captures only when waveform shape, transient behavior, or software configuration is important to the conclusion.
5. Calculate measurement uncertainty
Reporting “14.484 W” is misleading when the instruments cannot support that precision. Suppose you measure:
- Voltage: V = 12.04 ± 0.02 V
- Current: I = 1.203 ± 0.005 A
The calculated power is P = VI = 14.484 W. For independent uncertainties, a common approximation for multiplication is:
uP/P ≈ √[(uV/V)² + (uI/I)²]
The relative uncertainty is about 0.45%, so the absolute uncertainty is approximately 0.07 W. A defensible result is therefore P = 14.48 ± 0.07 W. Round the uncertainty to one or two significant figures, then round the result to the same decimal place.
Also distinguish accuracy, precision, resolution, and repeatability. Repeating a stable reading can estimate random variation, but repetition does not remove a calibration error or a systematic wiring mistake.
6. Discuss, do not merely describe
The discussion is where a technically correct report becomes useful. Compare measured and predicted values using a percentage difference or an uncertainty interval. If the experimental and theoretical ranges do not overlap, investigate plausible causes: component tolerance, sensor bandwidth, parasitic resistance, thermal drift, aliasing, contact resistance, model assumptions, or operator technique.
Avoid vague phrases such as “human error” or “results were close.” Name the mechanism, predict its direction, and estimate its likely size. For example: “The measured resistance was 1.8% higher than the nominal value; the component’s ±5% tolerance can explain the difference, while lead resistance would also bias a two-wire measurement upward.”
7. End with a numerical conclusion
The conclusion should answer the original objective in a short paragraph. State the principal result with its unit and uncertainty, compare it with the expected value, and say whether the evidence supports the model within the experiment’s limits. Do not introduce new figures or explanations here.
Final quality checklist
- Does the abstract include the main numerical result?
- Can another student reproduce the setup?
- Are all symbols, axes, columns, and values labeled with units?
- Are significant figures consistent with measurement uncertainty?
- Does each figure earn its place by supporting a claim?
- Does the discussion explain deviations with engineering reasoning?
- Are external equations, standards, datasheets, and images cited?
- Have you checked spelling, figure numbering, and cross-references?
Frequently asked questions
How long should an engineering lab report be?
Long enough to make the work reproducible and the conclusion defensible. For a single undergraduate experiment, clarity and evidence matter more than page count. Remove repeated theory and decorative screenshots before removing methods, uncertainty, or discussion.
Should raw data be included?
Include representative and processed data in the main report. Put large raw-data sets, long code listings, and calibration records in an appendix or linked repository, following your institution’s requirements.
What is the most common mistake?
Presenting measurements without interpreting their uncertainty. A small numerical difference is not automatically meaningful; it must be compared with the resolution, accuracy, and variation of the measurement process.
Continue learning in our Electrical Engineering and Education sections.